FlashAttention: optimize data movement before counting FLOPs
See why not storing an attention matrix can matter as much as arithmetic, and reconstruct softmax one tile at a time.
FlashAttention: Fast and Memory-Efficient Exact Attention with IO-Awareness · Dao et al. · arXiv:2205.14135
Original editorial analysis by Token Lab · Source checked 2026-10-25 · Paper claims and synthetic examples are separated.
Detailed technical articles are available in English and Chinese. This locale shows the English article with localized navigation.
01 · What the paper establishes
FlashAttention computes exact dense attention using tiling and online normalization to reduce HBM traffic. Its dense form is not a linear-time attention approximation. The paper reports hardware- and workload-specific speed improvements, which are not browser benchmark results.
Primary source: paper abstract ↗Study guide & lesson outline
LEARNING CONTRACTUnderstand → implement → investigate
Goal: explain the mechanism in this lesson, reproduce one example and test a failure case. Reading alone does not mark mastery.
- Understand: state assumptions, shapes/units and a counterexample.
- Implement: reproduce a numerical example and inspect boundaries.
- Investigate: compare one alternative under a matched budget.
02 · The mechanism
Text / 原始公式
New tile scores s, values V:
m′=max(m,max(s))
l′=exp(m−m′)l + Σ exp(sⱼ−m′)
u′=exp(m−m′)u + Σ exp(sⱼ−m′)Vⱼ
Output=u′/l′
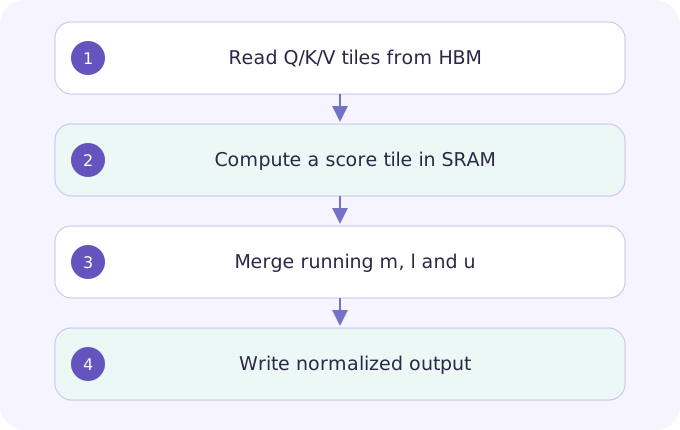
The row maximum m, denominator l and weighted numerator u are sufficient to merge another tile. When a larger maximum appears, rescale the old accumulators before adding the new tile. This is the same softmax algebra reorganized for memory locality. Backward computation can recompute intermediates instead of retaining the full probability matrix.
Notation and intuition are teaching explanations. Consult the original method for complete assumptions and implementation details.
Mechanism map & worked derivation
| Symbol | Meaning |
|---|---|
| m | Running maximum of one score row |
| l | Running exponential denominator |
| u | Running value-weighted numerator |
- Partition one row [2,1,0] into [2,1] and [0], with values [1,3] and [5]. After the first tile,
, and - The next tile has a smaller maximum, so m stays 2. Add e⁻² to l and 5e⁻² to u. The final u/l matches dense attention: approximately 1.849579.
- Now reverse tile order. The running maximum rises from 0 to 2, so both old l and old u must be multiplied by e⁻² before adding the second tile. This is the essential merge invariant.
Test reversed tile order, extreme logits and partial final tiles. Exact algebra still produces floating-point tolerance differences.
Change one variable. Explain what moves.
Original teaching calculation, not a reproduction of the paper’s benchmark. Bars are relative within this panel; numeric values and units are authoritative.
04 · Work through an example
Original memory example: one dense FP16 score matrix at
05 · Design your experiment
Implement dense and tiled softmax attention on a small CPU array. Compare outputs with tolerance, including large logits and causal boundaries. For a real GPU benchmark, warm up kernels, synchronize timing, fix dtype and head dimensions, record peak allocated memory and separate forward from backward. Report distributions of runtime, not a single cold-start measurement.
State one hypothesis; save the configuration and raw results; identify a competing explanation; report the narrowest supported conclusion. Use the linked lab as a local starting point, not a full paper reproduction.
Open related lesson / lab →06 · Limits & reviewer questions
Editorial caution: numerical equivalence is tolerance-based because floating-point reduction order changes. Exact attention still has quadratic arithmetic in sequence length. A score-tile diagram cannot predict speedup without accounting for SRAM capacity, bandwidth, occupancy and kernel launch overhead.
Why must the old numerator be rescaled when the running maximum increases?
Its terms were expressed relative to the old maximum. Multiplying by exp(m−m′) puts old and new contributions on the same exponential scale; otherwise the merged average is wrong.
07 · Read the original
Algorithm 1 and IO analysis; compare the exact and block-sparse variants explicitly.
Year is the first arXiv submission year. Unversioned links follow revisions; record the exact version in your reproduction report. DeepSeek-R1 here is explicitly pinned to v1.
Continue this topic
Transformer: turn token compatibility into information flow
Track Q, K and V, interpret a causal attention row, and distinguish parallel training from autoregressive generation.
Vaswani et al. · arXiv:1706.03762