Show Your Work: compare search budgets, not just winners
A better winning score can come from more attempts. Plot the selection process as part of the result.
Show Your Work: Improved Reporting of Experimental Results · Dodge et al. · arXiv:1909.03004
Original editorial analysis by Token Lab · Source checked 2026-10-25 · Paper claims and synthetic examples are separated.
Detailed technical articles are available in English and Chinese. This locale shows the English article with localized navigation.
01 · What the paper establishes
The paper proposes reporting expected best validation performance as a function of computation budget. It shows that model comparisons can change with search budget and argues for publishing development-time evidence alongside final test results.
Primary source: paper abstract ↗Study guide & lesson outline
LEARNING CONTRACTUnderstand → implement → investigate
Goal: explain the mechanism in this lesson, reproduce one example and test a failure case. Reading alone does not mark mastery.
- Understand: state assumptions, shapes/units and a counterexample.
- Implement: reproduce a numerical example and inspect boundaries.
- Investigate: compare one alternative under a matched budget.
02 · The mechanism
Text / 原始公式
For IID trial scores with common CDF F(s):
P(max(S₁,…,Sₙ) ≤ s)=F(s)ⁿ
Toy two-outcome search:
E[bestₙ]=a+(b−a)[1−(1−p)ⁿ]
Selecting the maximum is an operation performed by the experimenter. More trials increase the chance of finding a favorable setting even when the underlying algorithm is unchanged. The budget unit matters: ten cheap trials and ten expensive trials are not equal compute. Validation guides selection; the final test set should not become another search surface.
Notation and intuition are teaching explanations. Consult the original method for complete assumptions and implementation details.
Mechanism map & worked derivation
| Symbol | Meaning |
|---|---|
| F(s) | Distribution function of a single trial score |
| n | Number of independent search trials in the toy model |
| p | Chance of a high-scoring trial |
- The maximum is at most s only when every trial is at most s. Under independence and an identical score distribution, multiply the n probabilities to get F(s)ⁿ.
- With 10% success probability, failing all ten trials has probability 0.9¹⁰≈0.348678. At least one success therefore has probability 0.651322.
- For low/high scores 0.7 and 0.9, the expected best becomes 0.7+0.2×0.651322≈0.830264. This improvement can occur with an unchanged algorithm.
Compare both trial count and wall-clock compute. An adaptive search does not automatically satisfy the independent-trial derivation.
Change one variable. Explain what moves.
Original teaching calculation, not a reproduction of the paper’s benchmark. Bars are relative within this panel; numeric values and units are authoritative.
04 · Work through an example
Original synthetic search: every trial scores either 0.70 or 0.90, with a 10% chance of 0.90. With one trial the expected best is 0.72; with ten it is about 0.8303; with fifty it is about 0.8990. No algorithm improved. This deliberately simple independent-trial model illustrates selection pressure; it is not the paper’s empirical estimator.
05 · Design your experiment
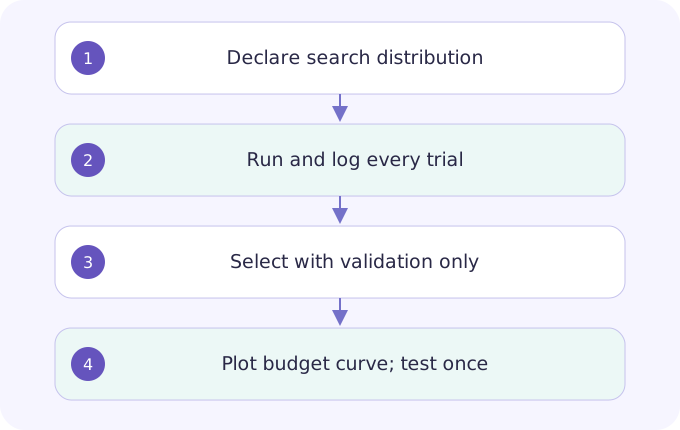
Log every hyperparameter trial with validation score, wall time, hardware and outcome. Compare methods over several matched budgets and specify whether the search is random, adaptive or manual. Select using validation only, then evaluate the selected checkpoint on a locked test set. Include unsuccessful runs in the cost accounting.
State one hypothesis; save the configuration and raw results; identify a competing explanation; report the narrowest supported conclusion. Use the linked lab as a local starting point, not a full paper reproduction.
Open related lesson / lab →06 · Limits & reviewer questions
Editorial caution: an independent-trial formula may not describe adaptive search or correlated configurations. Historical trial logs can be incomplete. A budget curve improves transparency but does not eliminate benchmark leakage or make different hardware perfectly comparable.
Can a model win at one budget and lose at another?
Yes. A robust model may produce good results frequently while another has rare high-scoring configurations. Their expected-best curves can cross, so the budget is part of the claim.
07 · Read the original
Expected validation performance and computation-budget comparisons.
Year is the first arXiv submission year. Unversioned links follow revisions; record the exact version in your reproduction report. DeepSeek-R1 here is explicitly pinned to v1.
Continue this topic
Calibration: being right is different from knowing how often
Adjust temperature without changing class ranking, and learn why one confidence score cannot establish calibration.
Guo et al. · arXiv:1706.04599
Deep RL that Matters: a score is a distribution
Separate seed variation, implementation choices and model selection before declaring an improvement.
Henderson et al. · arXiv:1709.06560
LLM-as-a-judge: evaluate the evaluator
Separate answer preference from correctness and reveal how order effects can alter a reported win rate.
Zheng et al. · arXiv:2306.05685