Calibration: being right is different from knowing how often
Adjust temperature without changing class ranking, and learn why one confidence score cannot establish calibration.
On Calibration of Modern Neural Networks · Guo et al. · arXiv:1706.04599
Original editorial analysis by Token Lab · Source checked 2026-10-25 · Paper claims and synthetic examples are separated.
01 · What the paper establishes
The paper studies confidence calibration in modern classifiers and evaluates post-processing methods. Temperature scaling often helps in its experiments. Calibration is a statistical relationship between predictions and outcomes, not a property established by one example.
Primary source: paper abstract ↗Study guide & lesson outline
LEARNING CONTRACTUnderstand → implement → investigate
Goal: explain the mechanism in this lesson, reproduce one example and test a failure case. Reading alone does not mark mastery.
- Understand: state assumptions, shapes/units and a counterexample.
- Implement: reproduce a numerical example and inspect boundaries.
- Investigate: compare one alternative under a matched budget.
02 · The mechanism
Text / 原始公式
pᵢ(T)=exp(zᵢ/T)/Σⱼ exp(zⱼ/T), T>0
T* = argmin_T validation NLL
ECE = Σ_b (|B_b|/n) |accuracy(B_b)−confidence(B_b)|
Positive temperature scaling preserves logit order, so the predicted top class stays the same. It changes how concentrated the probability distribution is. To test calibration, group many predictions with similar confidence and compare their average confidence with empirical correctness. Bin boundaries and sample counts affect the result; ECE alone is not a complete diagnostic.
Notation and intuition are teaching explanations. Consult the original method for complete assumptions and implementation details.
Mechanism map & worked derivation
| Symbol | Meaning |
|---|---|
| T>0 | Positive calibration temperature |
| z | Unnormalized class logits |
| B_b | A confidence bin with observed outcomes |
- Positive scaling leaves the logit order unchanged. Thus top-1 predictions stay fixed while confidence changes. This is a direct order-preservation argument.
- For logits [2,1,0], top confidence changes from 0.665241 at
to 0.506480 at Whether this helps depends on correctness frequencies across many examples. - Synthetic ECE: 50 cases average confidence 0.8 with accuracy 0.6, and 50 cases confidence 0.6 with accuracy 0.6. Weighted absolute gaps yield 0.5×0.2+0.5×0=0.1.
Record bin counts and split identities. Never choose T using the final test labels.
Change one variable. Explain what moves.
Original teaching calculation, not a reproduction of the paper’s benchmark. Bars are relative within this panel; numeric values and units are authoritative.
04 · Work through an example
Original example: logits [2,1,0] produce top confidence about 0.665 at
05 · Design your experiment
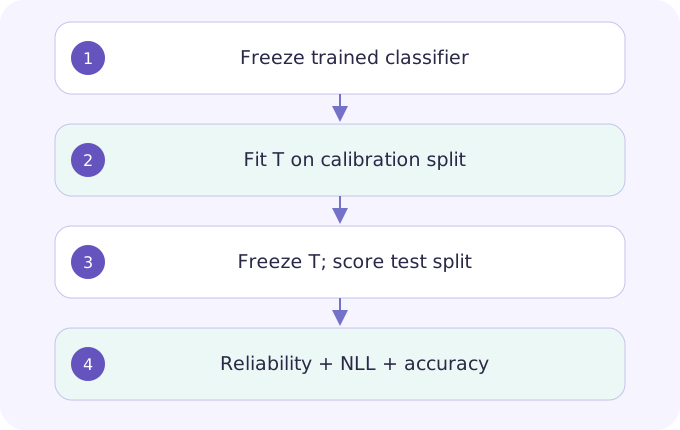
Use disjoint training, calibration and test sets. Fit one positive T by calibration-set NLL, freeze it and evaluate once on test data. Report NLL, Brier score, reliability diagrams and bin counts alongside accuracy. Repeat the diagnostic on a shifted dataset without refitting to see whether the original correction transfers.
State one hypothesis; save the configuration and raw results; identify a competing explanation; report the narrowest supported conclusion. Use the linked lab as a local starting point, not a full paper reproduction.
Open related lesson / lab →06 · Limits & reviewer questions
Editorial caution: lowering confidence is not automatically improving calibration. A previously underconfident classifier may get worse. A global temperature cannot repair all class-specific errors or distribution shifts; task-specific decision thresholds require their own validation.
Why can accuracy remain fixed while negative log-likelihood improves?
Accuracy uses only the largest-probability class. NLL uses the probability assigned to the true class, so redistributing mass can improve it without changing any argmax.
07 · Read the original
Calibration metrics, reliability diagrams and temperature scaling; inspect how the held-out set is used.
Year is the first arXiv submission year. Unversioned links follow revisions; record the exact version in your reproduction report. DeepSeek-R1 here is explicitly pinned to v1.
Continue this topic
Deep RL that Matters: a score is a distribution
Separate seed variation, implementation choices and model selection before declaring an improvement.
Henderson et al. · arXiv:1709.06560
Show Your Work: compare search budgets, not just winners
A better winning score can come from more attempts. Plot the selection process as part of the result.
Dodge et al. · arXiv:1909.03004
LLM-as-a-judge: evaluate the evaluator
Separate answer preference from correctness and reveal how order effects can alter a reported win rate.
Zheng et al. · arXiv:2306.05685