1. Why not treat 1000 examples from one training run as 1000 seeds?
Show answer & scoring criteria
They do not capture independent training randomness. The sampling unit must match the uncertainty being estimated.
Analyze paired run means, uncertainty and a predeclared practical improvement threshold.
Local calculations and synthetic examples. No paid API or live-model benchmark.Goal: explain the mechanism in this lesson, reproduce one example and test a failure case. Reading alone does not mark mastery.
Prerequisites · Means, variance, independent units, paired comparisons.
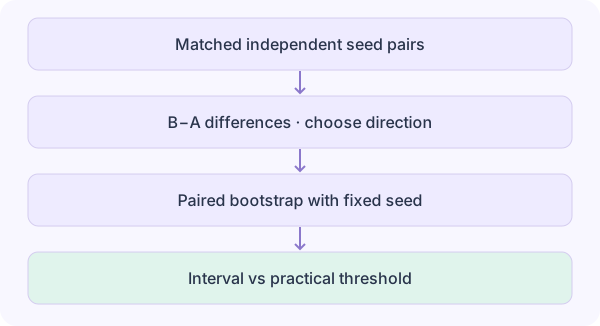
Pair runs only when they share a meaningful experimental unit. Bootstrap whole pairs so covariance is retained. This lab treats each row as an independent run/seed mean, not each example from one run. Compare the interval with a pre-specified practical threshold.
dᵢ = Bᵢ − Aᵢ (reverse sign for lower-is-better)
Δ = mean(dᵢ)
Resample n pairs with replacement, 2000 times
CI = [percentile₂.₅, percentile₉₇.₅]
Common pitfall: A narrow interval is not protection against leakage, correlated seeds, benchmark selection or an unfair tuning budget.
For paired improvements [0.02,0.04,0.03], what is the mean improvement in metric units?
(0.02+0.04+0.03)/3 = 0.03; for accuracy this is 3 percentage points
Analyze the sample, reverse metric direction, and duplicate a seed ID to observe validation. Then compare a noisy run set with the same mean improvement. Explain why mean alone is insufficient.
Deliver: input configurations, exported results, controlled variables, observations, alternative explanations and the next validation step.
An interval crossing the threshold is inconclusive under this rule. An interval above it is evidence conditional on sampling assumptions, not proof of causation or freedom from leakage.
Run the experiment to see evidence.
Only compare runs with controlled inputs. Exports include inputs and methods.
Self-assessment: explain the mechanism, identify assumptions, and propose a discriminating test. No automatic LLM grading.
They do not capture independent training randomness. The sampling unit must match the uncertainty being estimated.
Choosing it after seeing results encourages selective conclusions. Thresholds should reflect the task and cost of deployment.
Data and splits, training and tuning budget, evaluation protocol, seed pairing and selection of the reported checkpoint.
95% paired percentile bootstrap, 2000 resamples, at most 200 rows. Small samples and constant deltas can be misleading. No multiple-testing correction, power calculation or automatic causal inference.
arXiv:1709.06560 · 2017
Henderson et al. · Year denotes first arXiv submission
Read: Sources of experimental variability and reporting recommendations.
Reading checkpoint: Separate randomness from implementation and tuning differences. RL findings motivate controls; do not blindly transfer its numerical results to LLMs.
@misc{arxiv170906560,
  title = {Deep Reinforcement Learning that Matters},
  year = {2017},
  eprint = {1709.06560},
  archivePrefix = {arXiv},
  url = {https://arxiv.org/abs/1709.06560}
}
arXiv:1909.03004 · 2019
Dodge et al. · Year denotes first arXiv submission
Read: Expected validation performance under a computational budget; model selection.
Reading checkpoint: Report search space, trial count and selection rule alongside the final score.
@misc{arxiv190903004,
  title = {Show Your Work: Improved Reporting of Experimental Results},
  year = {2019},
  eprint = {1909.03004},
  archivePrefix = {arXiv},
  url = {https://arxiv.org/abs/1909.03004}
}95% paired percentile bootstrap, 2000 resamples, at most 200 rows. Small samples and constant deltas can be misleading. No multiple-testing correction, power calculation or automatic causal inference.
Objective, derivatives, worked examples and implementation reviewed. A passing finite-difference or manifest check is not a paper reproduction certificate.
Analyze the sample, reverse metric direction, and duplicate a seed ID to observe validation. Then compare a noisy run set with the same mean improvement. Explain why mean alone is insufficient.
Keep the baseline input fixed, change one parameter or boundary, and compare both the numerical result and the claimed units. A passing example verifies this fixture only.
Save the example and linked modules in one folder. Use Node.js 22 or newer, then run node experiment-design.mjs. No third-party runtime dependencies.
import {runPhd} from './phd-core.mjs';
const params={
  "csv": "id,a,b\n1,0.72,0.75\n2,0.74,0.76\n3,0.71,0.75\n4,0.75,0.76\n5,0.73,0.76",
  "direction": "higher",
  "threshold": 0.01,
  "seed": 42
};
console.log(runPhd('experiment-design',params));Analyze the sample, reverse metric direction, and duplicate a seed ID to observe validation. Then compare a noisy run set with the same mean improvement. Explain why mean alone is insufficient.
Record input, code version, expected result and observed result in the notebook below. Then construct a counterexample that violates the assumption above and explain why the original conclusion no longer follows.
Download complete kit (.tar.gz) · Complete reference kit and regression checksBefore revealing an answer, predict one result. After the exercise, record the discrepancy and a transfer test. Saved locally across language editions.
Open notebook / export / clear →The mathematical review scope is recorded per lesson. It does not establish empirical paper reproduction; report suspected errors in your notes. Review scope