Laboratorio de muestreo: logits → tokens
Prueba temperature, top-k y top-p en una distribución local reproducible.
Study guide & lesson outline
LEARNING CONTRACTUnderstand → implement → investigate
Goal: explain the mechanism in this lesson, reproduce one example and test a failure case. Reading alone does not mark mastery.
- Understand: state assumptions, shapes/units and a counterexample.
- Implement: reproduce a numerical example and inspect boundaries.
- Investigate: compare one alternative under a matched budget.
01Configurar
02Añadir entrada
Configura los parámetros, carga un ejemplo o pega tus datos.
03Revisar resultados
Configura los parámetros, carga un ejemplo o pega tus datos.
La vista puede estar truncada; el JSON exportado incluye todos los resultados calculados.
Cómo interpretar los resultados
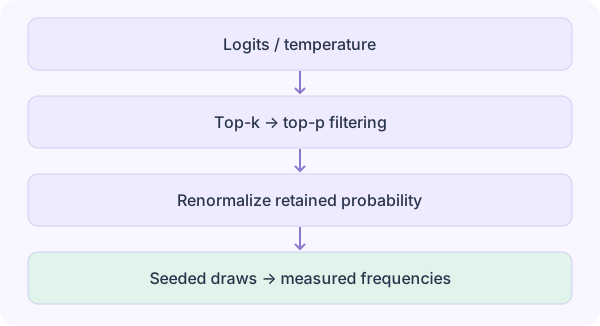
CSV: token,logit; etiquetas únicas no vacías y logits finitos entre −10.000 y 10.000. Se aplica temperatura, luego top-k y top-p, renormalizando tras cada filtro. Temperatura 0 usa selección voraz; los empates siguen el orden de entrada. Las frecuencias proceden de un muestreador con semilla, no de un modelo real. Máximo: 100 candidatos y 10.000 muestras.
Referencias del método
Assumptions, implementation & acceptance
Filtering order is temperature, top-k, then top-p and renormalization. Entropy is in bits. Temperature zero is explicitly greedy; stochastic draws depend on the seed.
Reviewed counting units, statistical assumptions and numerical examples. Provider accounting and actual GPU allocation still require external measurement.
Before running: predict a boundary case
Filtering order is temperature, top-k, then top-p and renormalization. Entropy is in bits. Temperature zero is explicitly greedy; stochastic draws depend on the seed.
Hint: isolate the assumption
Keep the baseline input fixed, change one parameter or boundary, and compare both the numerical result and the claimed units. A passing example verifies this fixture only.
Minimal executable example
Save the example and linked modules in one folder. Use Node.js 22 or newer, then run node sampling-lab.mjs. npm install gpt-tokenizer@4.1.0
import {encode as rawEncode} from 'gpt-tokenizer/encoding/cl100k_base';
import {promptDiff,inspectDataset,chunkDocument,compareScores,estimateVRAM,samplingLab,speculativeLab} from './research-core.mjs';
const encode=s=>rawEncode(s,{disallowedSpecial:new Set()});
const result=samplingLab('token,logit\na,0\nb,0',1,0,1,10000,42);
console.log(result.entropy); // 1 bit; observed frequencies only approximate 0.5Test and transfer
Filtering order is temperature, top-k, then top-p and renormalization. Entropy is in bits. Temperature zero is explicitly greedy; stochastic draws depend on the seed.
Record input, code version, expected result and observed result in the notebook below. Then construct a counterexample that violates the assumption above and explain why the original conclusion no longer follows.
Download complete kit (.tar.gz) · Complete reference kit and regression checksPredict, test and keep evidence
Before revealing an answer, predict one result. After the exercise, record the discrepancy and a transfer test. Saved locally across language editions.
Open notebook / export / clear →The mathematical review scope is recorded per lesson. It does not establish empirical paper reproduction; report suspected errors in your notes. Review scope