Sampling lab: logits → tokens
Test temperature, top-k and nucleus sampling against a reproducible local distribution.
Study guide & lesson outline
LEARNING CONTRACTUnderstand → implement → investigate
Goal: explain the mechanism in this lesson, reproduce one example and test a failure case. Reading alone does not mark mastery.
- Understand: state assumptions, shapes/units and a counterexample.
- Implement: reproduce a numerical example and inspect boundaries.
- Investigate: compare one alternative under a matched budget.
01Configure
02Add your input
Choose settings, load an example, or paste your own input.
03Inspect results
Choose settings, load an example, or paste your own input.
The display may be truncated; the exported JSON report contains all computed results.
How to interpret this
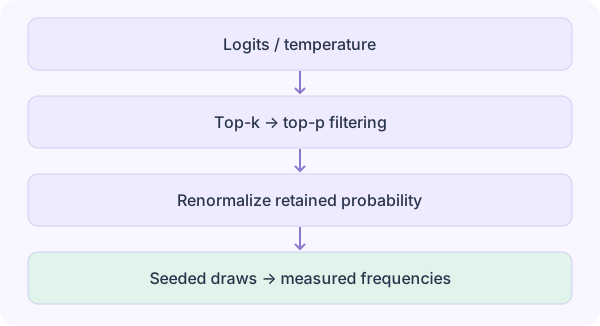
CSV columns: token,logit. Use unique nonempty token labels and finite logits from −10,000 to 10,000. Temperature applies first, then top-k, then top-p; probabilities are renormalized after each filter. At temperature 0 this tool uses greedy selection (ties use input order). Frequencies come from a seeded categorical sampler, not a live language model. Up to 100 candidates and 10,000 draws.
Method references
Assumptions, implementation & acceptance
Filtering order is temperature, top-k, then top-p and renormalization. Entropy is in bits. Temperature zero is explicitly greedy; stochastic draws depend on the seed.
Reviewed counting units, statistical assumptions and numerical examples. Provider accounting and actual GPU allocation still require external measurement.
Before running: predict a boundary case
Filtering order is temperature, top-k, then top-p and renormalization. Entropy is in bits. Temperature zero is explicitly greedy; stochastic draws depend on the seed.
Hint: isolate the assumption
Keep the baseline input fixed, change one parameter or boundary, and compare both the numerical result and the claimed units. A passing example verifies this fixture only.
Minimal executable example
Save the example and linked modules in one folder. Use Node.js 22 or newer, then run node sampling-lab.mjs. npm install gpt-tokenizer@4.1.0
import {encode as rawEncode} from 'gpt-tokenizer/encoding/cl100k_base';
import {promptDiff,inspectDataset,chunkDocument,compareScores,estimateVRAM,samplingLab,speculativeLab} from './research-core.mjs';
const encode=s=>rawEncode(s,{disallowedSpecial:new Set()});
const result=samplingLab('token,logit\na,0\nb,0',1,0,1,10000,42);
console.log(result.entropy); // 1 bit; observed frequencies only approximate 0.5Test and transfer
Filtering order is temperature, top-k, then top-p and renormalization. Entropy is in bits. Temperature zero is explicitly greedy; stochastic draws depend on the seed.
Record input, code version, expected result and observed result in the notebook below. Then construct a counterexample that violates the assumption above and explain why the original conclusion no longer follows.
Download complete kit (.tar.gz) · Complete reference kit and regression checksPredict, test and keep evidence
Before revealing an answer, predict one result. After the exercise, record the discrepancy and a transfer test. Saved locally across language editions.
Open notebook / export / clear →The mathematical review scope is recorded per lesson. It does not establish empirical paper reproduction; report suspected errors in your notes. Review scope